Learner Progress: Capturing the Adult Learner
Published by: WCET | 12/14/2011
Tags: Completion, Data And Analytics, IPEDS, Retention
Published by: WCET | 12/14/2011
Tags: Completion, Data And Analytics, IPEDS, Retention
Cali Morrison, Transparency by Design Project Director, brings to Frontiers the process by which the Transparency by Design initiative created the recently launched learner progress metrics available on its website College Choices for Adults.
The Problem
Transparency by Design (TbD) member institutions recognized that the national metrics for measuring learner retention and completion, the Integrated Postsecondary Education Data System (IPEDS) Graduation Rate Survey (GRS) were not capturing the majority of their students – those learners returning to college and attending part-time. The IPEDS GRS takes those students who enter into an institution as first-time, full-time students, puts them in a cohort and looks at where they are at 100% and 150% of “normal time” (defined as 4 and 6 years for a bachelors degree, for example). The problem here is that this cohort only comprises a small percentage of students at TbD member institutions. For one institution, none of their students fit into this category. So, when journalists and legislators and students are talking about and considering the performance of an institution based on the IPEDS GRS, they are not considering the whole picture for many institutions.
The Process
Coming to a solution for capturing a greater proportion of students was no simple task. TbD institutions span a wide range of institutional model – some are more traditional online or hybrid programs, some are competency based, some are degree completion and some are primarily graduate. Trying to accommodate all of these institutions, how they count students as enrolled and still have a metric that is understandable for a person without an advanced degree in statistics was a challenge. The learner progress committee* considered models that looked more deeply at the moment a student becomes a student, models that would account for more of the ‘swirl’, or in other words students who transfer in and out and back in, but each of those models was met with barriers to comparability and validity. In pilots the metric was not being applied consistently across institutions and therefore the resulting reports were not truly comparable across institutions.
The Solution
After several unsuccessful pilot metrics, the learner progress committee decided to build from a widely recognized and accepted methodology with a construct that can be reliably replicated at many different institutions. The IPEDS GRS provided the base needed to build Learner Progress. However, in contrast to the GRS, the Learner Progress metrics include transfer-in and part-time students in the cohort in addition to first-time, full-time students. All other parameters for cohort development remain the same. This helps the learner progress metric maintain the face validity of the graduation rate survey while capturing a more accurate picture of the adult learner.

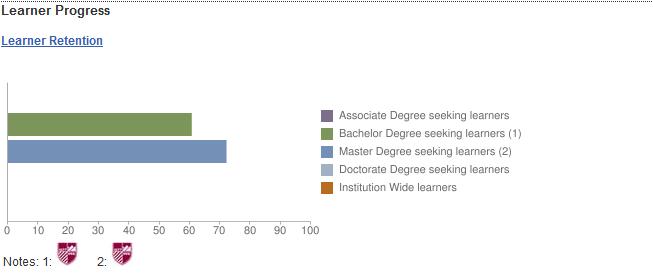
Learner Progress is divided into two distinct categories – Learner Retention and Learner Completion. Learner retention reports the percentage of students who remain enrolled or complete a degree/certificate after one year. Institutions have the opportunity to report learner retention at the degree level, which is preferred, or for those who are not able to report at the degree level, they may report at the institution-wide level. Learner completion reports the percentage of the cohort which completed a degree within 150% and 200% of ‘normal time,’ as defined by IPEDS (for example, ‘normal time’ for a bachelors degree is 4 years). Another interesting piece of learner completion is the opportunity for institutions which have transfer as a core part of their mission to report out the percentage of the cohort which has successfully transferred to another institution at 150% of normal time. We currently do not have any institutions tracking and reporting this data but the purpose was to be more inclusive of community colleges. There are currently 67% of institutions involved in the Transparency by Design initiative reporting this data on the College Choices for Adults website.
What’s next
TbD challenges accrediting bodies, federal regulators, and reciprocity compacts to adopt this metric into their quality standards and adult learners to stand up and demand to be counted and provided with data that is reflective of their situation to help inform their educational pathways. As always, TbD challenges institutions serving adult learners at a distance to set themselves apart from the crowd by reporting this and other data VOLUNTARILY on the College Choices for Adults website.
*This blog would not be complete without a special thank you to the Learner Progress Committee who put many hours of work into this effort: David Hemenway, Charter Oak State College; Kim Pearce, Capella University; Lisa Daniels, Excelsior College; Jennifer Mauldin, Regis University; Linda Van Volkenburgh; Union Institute & University; Dave Becher, American Public University System; Karen Paulson, NCHEMS; and Russ Poulin and Cali Morrison, WCET.